Warnings Plugin 5.0 (White Mountain) Public Beta

| This is a guest post by Ullrich Hafner, professor for Software Engineering at the University of Applied Sciences Munich and Jenkins contributor. He will be presenting Static Analysis Plugins - White Mountain Release for Pipelines at DevOps World | Jenkins World 2018. |

Jenkins' Warnings plugin collects compiler warnings or issues reported by static analysis tools and visualizes the results. The plugin (and the associated static analysis plugin suite) has been part of the Jenkins plugin eco-system for more than ten years now. In order to optimize user experience and support Pipeline, a major rewrite of the whole set of plugins was necessary. This new version (code name White Mountain) is now available as a public beta. Please download and install this new version and help us to identify problems before the API is sealed.
The new release is available in the experimental update center. It has built-in support for almost hundred static analysis tools (including several compilers), see the list of supported report formats.
Features overview
The Warnings plugin provides the following features when added as a post build action (or step) to a job:
-
The plugin scans the console log of a Jenkins build or files in the workspace of your job for any kind of issues. There are almost one hundred report formats supported. Among the problems it can detect:
-
errors from your compiler (C, C#, Java, etc.)
-
warnings from a static analysis tool (CheckStyle, StyleCop, SpotBugs, etc.)
-
duplications from a copy-and-paste detector (CPD, Simian, etc.)
-
vulnerabilities
-
open tasks in comments of your source files
-
-
The plugin publishes a report of the issues found in your build, so you can navigate to a summary report from the main build page. From there you can also dive into the details:
-
distribution of new, fixed and outstanding issues
-
distribution of the issues by severity, category, type, module, or package
-
list of all issues including helpful comments from the reporting tool
-
annotated source code of the affected files
-
trend charts of the issues
-
In the next sections, I’ll show the new and enhanced features in more detail.
One plugin for all tools
Previously the warnings plugin was part of the static analysis suite that provided the same set of features through several plugins (CheckStyle, PMD, Static Analysis Utilities, Analysis Collector etc.). In order to simplify the user experience and the development process, these plugins and the core functionality have been merged into the warnings plugin. All other plugins are not required anymore and will not be supported in the future. If you currently use one of these plugins you should migrate to the new recorders and steps as soon as possible. I will still maintain the old code for a while, but the main development effort will be spent into the new code base.
The following plugins have been integrated into the beta version of the warnings plugin:
-
Android-Lint Plugin
-
CheckStyle Plugin
-
CCM Plugin
-
Dry Plugin
-
PMD Plugin
-
FindBugs Plugin
All other plugins still need to be integrated or need to be refactored to use the new API.
New pipeline support
Requirements for using the Warnings plugin in Jenkins Pipeline can be complex and sometimes controversial. In order to be as flexible as possible I decided to split the main step into two individual parts, which could then be used independently from each other.
Simple pipeline configuration
The simple pipeline configuration is provided by the step recordIssues. This step is automatically derived from the
FreeStyle job recorder: it scans for issues in a given set of files (or in the console log) and reports these issues
in your build. You can use the snippet generator to create a working snippet that calls this step. A typical example
of this step is shown in the following example:
recordIssues
    enabledForFailure: true,
    tools: [[pattern: '*.log', tool: [$class: 'Java']]],
    filters: [includeFile('MyFile.*.java'), excludeCategory('WHITESPACE')]
In this example, the files '*.log' are scanned for Java issues. Only issues with a file name matching the pattern 'MyFile.*.java' are included. Issues with category 'WHITESPACE' will be excluded. The step will be executed even if the build failed. The recorded report of warnings will be published under the fixed URL 'https://[your-jenkins]/job/[your-job]/java'. URL or name of the report can be changed if required.
Advanced Pipeline Configuration
Sometimes publishing and reporting issues using a single step is not sufficient. For instance, if you build your product using several parallel steps and you want to combine the issues from all of these steps into a single result. Then you need to split scanning and aggregation. Therefore, the plugin provides the following two steps that are combined by using an intermediate result object:
-
scanForIssues: this step scans a report file or the console log with a particular parser and creates an intermediate report object that contains the report. -
publishIssues: this step publishes a new report in your build that contains the aggregated results of one or severalscanForIssuessteps.
You can see the usage of these two steps in the following example:
def java = scanForIssues tool: [$class: 'Java']
def javadoc = scanForIssues tool: [$class: 'JavaDoc']

publishIssues issues:[java, javadoc], filters:[includePackage('io.jenkins.plugins.analysis.*')]

def checkstyle = scanForIssues tool: [$class: 'CheckStyle'], pattern: '**/target/checkstyle-result.xml'
publishIssues issues:[checkstyle]

def pmd = scanForIssues tool: [$class: 'Pmd'], pattern: '**/target/pmd.xml'
publishIssues issues:[pmd]

publishIssues id:'analysis', name:'White Mountains Issues', issues:[checkstyle, pmd],
    filters:[includePackage('io.jenkins.plugins.analysis.*')]
Filtering issues
The created report of issues can be filtered afterwards. You can specify an arbitrary number of include or exclude filters. Currently, there is support for filtering issues by module name, package or namespace name, file name, category or type.
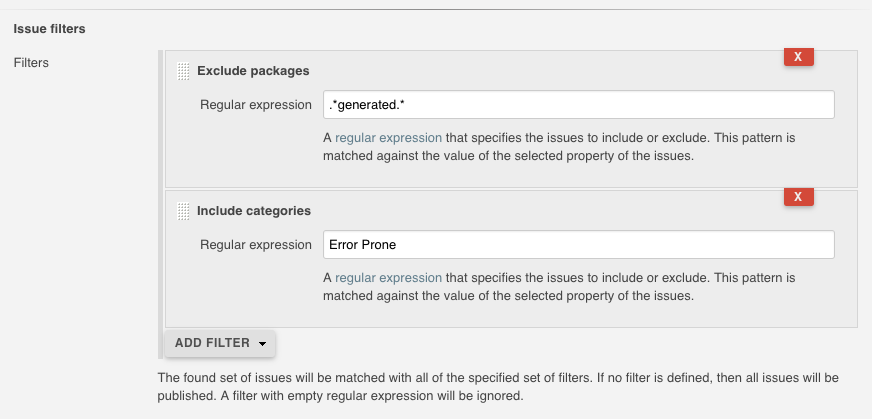
An example pipeline that uses such a filter is shown in the following snippet:
recordIssues
    tools: [[pattern: '*.log', tool: [$class: 'Java']]],
    filters: [includeFile('MyFile.*.java'), excludeCategory('WHITESPACE')]
Quality gate configuration
You can define several quality gates that will be checked after the issues have been reported. These quality gates let you to modify Jenkins' build status so that you immediately see if the desired quality of your product is met. A build can be set to unstable or failed for each of these quality gates. All quality gates use a simple metric: the maximum number of issues that can be found and still pass a given quality gate.
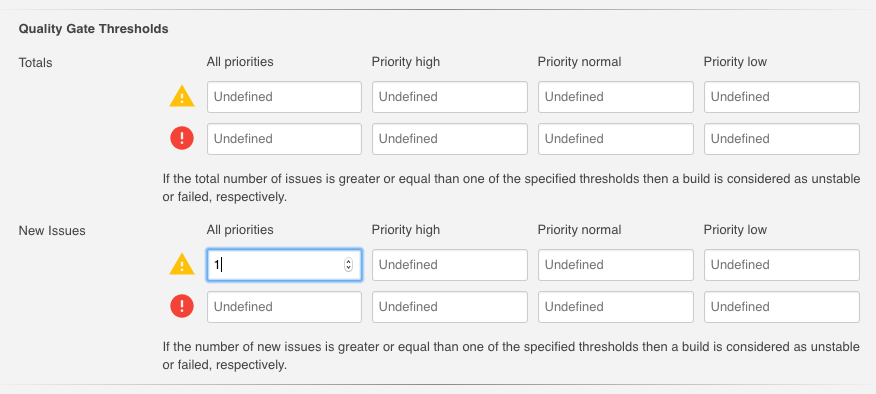
An example pipeline that enables a quality gate for 10 warnings in total or 1 new warning is shown in the following snippet:
recordIssues
    tools: [[pattern: '*.log', tool: [$class: 'Java']]], unstableTotalHigh: 10, unstableNewAll: 1
Issues history: new, fixed, and outstanding issues
One highlight of the plugin is the ability to categorize issues of subsequent builds as new, fixed and outstanding.
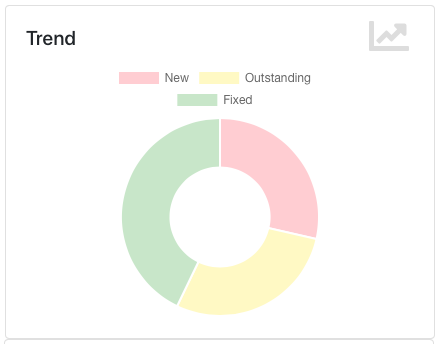
Using this feature makes it a lot easier to keep the quality of your project under control: you can focus only on those warnings that have been introduced recently.
Note: the detection of new warnings is based on a complex algorithm that tries to track the same warning in two two different versions of the source code. Depending on the extend of the modification of the source code it might produce some false positives, i.e., you might still get some new and fixed warnings even if there should be none. The accuracy of this algorithm is still ongoing research and will be refined in the next couple of months.
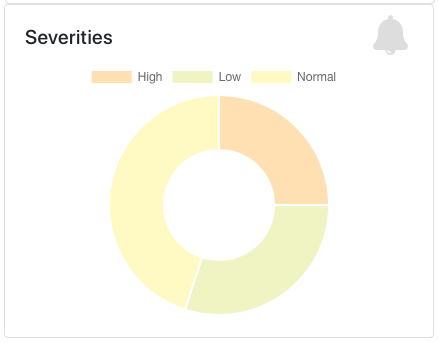
Severities
The plugin shows the distribution of the severities of the issues in a chart. It defines the following default severities, but additional ones might be added by plugins that extend the warnings plugin.
-
Error: Indicates an error that typically fails the build
-
Warning (High, Normal, Low): Indicates a warning of the given priority. Mapping to the priorities is up to the individual parsers.
Note that not every parser is capable of producing warnings with a different severity. Some of the parses simply use the same severity for all issues.
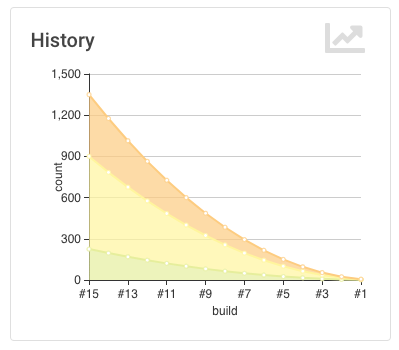
Build Trend
In order to see the trend of the analysis results, a chart showing the number of issues per build is also shown. This chart is used in the details page as well as in the job overview. Currently, type and configuration of the chart is fixed. This will be enhanced in future versions of the plugin.
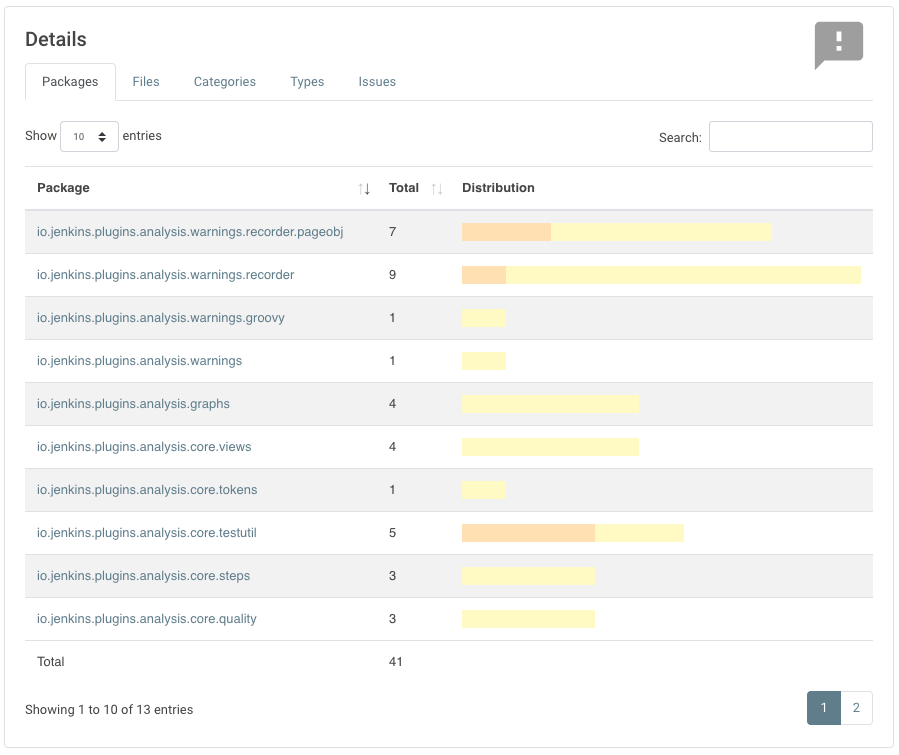
Issues Overview
You can get a fast and efficient overview of the reported set of issues in several aggregation views. Depending on the number or type of issues you will see the distribution of issues by
-
Static Analysis Tool
-
Module
-
Package or Namespace
-
Severity
-
Category
-
Type
Each of these detail views are interactive, i.e. you can navigate into a subset of the categorized issues.
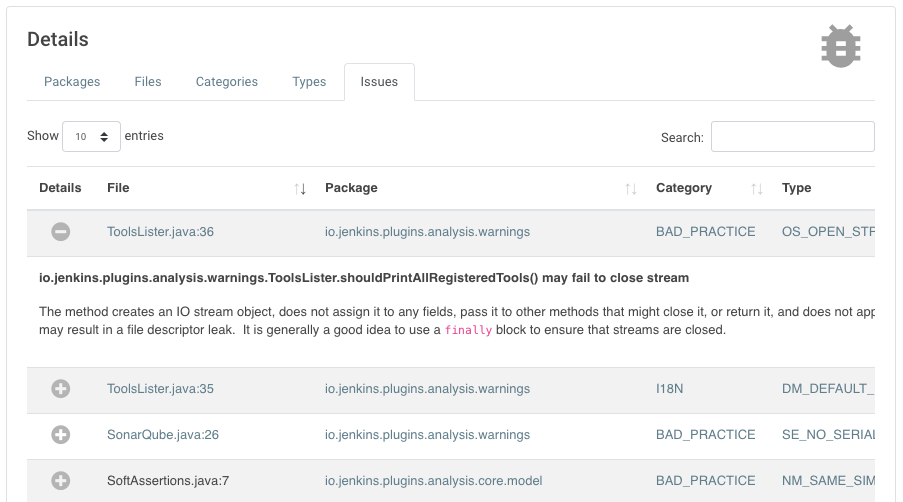
Issues Details
The set of reported issues is shown in a modern and responsive table. The table is loaded on demand using an Ajax call. It provides the following features:
-
Pagination: the number of issues is subdivided into several pages which can be selected by using the provided page links. Note that currently the pagination is done on the client side, i.e. it may take some time to obtain the whole table of issues from the server.
-
Sorting: the table content can be sorted by clicking on one of the table columns.
-
Filtering, Searching: you can filter the shown issues by entering some text in the search box.
-
Content Aware: columns are only shown if there is something useful to display. I.e., if a tool does not report an issues category, then the category will be automatically hidden.
-
Responsive: the layout should adapt to the actual screen size.
-
Details: the details message for an issue (if provided by the corresponding static analysis tool) is shown as child row within the table.
Remote API
The plugin provides two REST API endpoints.
Summary of the analysis result
You can obtain a summary of a particular analysis report by using the URL [tool-id]/api/xml
(or [tool-id]/api/json). The summary contains the number of issues, the quality gate status, and all
info and error messages.
Details of the analysis result
The reported issues are also available as REST API. You can either query all issues or only the new, fixed, or outstanding issues. The corresponding URLs are:
-
[tool-id]/all/api/xml: lists all issues -
[tool-id]/fixed/api/xml: lists all fixed issues -
[tool-id]/new/api/xml: lists all new issues -
[tool-id]/outstanding/api/xml: lists all outstanding issues
How You Can Help
I hope these new features are useful for everyone! Please download or install this new release and test it in your jobs:
-
Convert some of your jobs to the new API and test the new (and old) features (based on your requirements).
-
Read all labels carefully, I’m not a native speaker so some descriptions might be misleading or incorrect.
-
Check the new URLs and names of the parsers, see list of supported report formats. These can’t be changed after the beta testing.
If you find a problem, incorrect phrase, typo, etc. please report a bug in Jira (or even better: file a PR in GitHub).
This has been a brief overview of the new features of the Warnings plugin in Jenkins. For more, be sure to check out my talk at "DevOps World | Jenkins World" where I show more details of the Warnings plugin!
|
Come see Ullrich Hafner and many other Jenkins experts and contributors at
DevOps World | Jenkins World on September 16-19th,
register with the code |
About the author