Hands On: Beautify the user interface of Jenkins reporter plugins

This article has been presented in an recorded online session during the Jenkins 2020 UI/UX Hackfest.
For Jenkins a large number of plugins are available that visualize the results of a wide variety of build steps. There are plugins available to render the test results, the code coverage, the static analysis and so on. All of these plugins typically pick up the build results of a given build step and show them in the user interface. In order to render these details most of the plugins use static HTML pages, since this type of user interface is the standard visualization in Jenkins since its inception in 2007.
In order to improve the look and feel and the user experience of these plugins it makes sense to move forward and incorporate some modern Java Script libraries and components. Since development of Blue Ocean has been stopped (see Jenkins mailing list post) plugin authors need to decide on their own, which UI technologies are helpful for that task. However, the universe of modern UI components is so overwhelming that it makes sense to pick up only a small set of components that are proven to be useful and compatible with Jenkins underlying web technologies. Moreover, the initial setup of incorporating such a new component is quite large so it would be helpful if that work needs to be done only once.
This guide introduces a few UI components that make sense to be used by all plugin authors in the future to provide a rich user interface for reports in Jenkins. In order to simplify the usage of these libraries in the context of Jenkins as a Java based web application, these Java Script libraries and components have been packaged as ordinary Jenkins plugins.
In the following sections, these new components will be introduced step by step. In order to see how these components can be used a plugin, I demonstrate the new features while enhancing the existing Forensics Plugin with a new user interface. Since the Warnings Next Generation Plugin also uses these new components, you can see additional examples in the documentation of the warnings plugin or in our public ci.jenkins.io instance, that already is using these components in the detail views of the warnings plugin.
1. New user interface plugins
The following UI components are provided as new Jenkins plugins:
-
jquery3-api-plugin: Provides jQuery 3 for Jenkins Plugins. jQuery is — as described on their home page — a fast, small, and feature-rich JavaScript library. It makes things like HTML document traversal and manipulation, event handling, animation, and Ajax much simpler with an easy-to-use API that works across a multitude of browsers. With a combination of versatility and extensibility, jQuery has changed the way that millions of people write JavaScript.
-
bootstrap4-api-plugin: Provides Bootstrap 4 for Jenkins Plugins. Bootstrap is — according to their self-perception — the world’s most popular front-end component library to build responsive, mobile-first projects on the web. It is an open source toolkit for developing with HTML, CSS, and JS. Developers can quickly prototype their ideas or build entire apps with their Sass variables and mixins, responsive grid system, extensive prebuilt components, and powerful plugins built on jQuery.
-
data-tables-api-plugin: Provides DataTables for Jenkins Plugins. DataTables is a plug-in for the jQuery Javascript library. It is a highly flexible tool, built upon the foundations of progressive enhancement, that adds all of these advanced features to any HTML table:
-
Previous, next and page navigation
-
Filter results by text search
-
Sort data by multiple columns at once
-
DOM, Javascript, Ajax and server-side processing
-
Easily theme-able
-
Mobile friendly
-
-
echarts-api-plugin: Provides ECharts for Jenkins Plugins. ECharts is an open-sourced JavaScript visualization tool to create intuitive, interactive, and highly-customizable charts. It can run fluently on PC and mobile devices and it is compatible with most modern Web Browsers.
-
font-awesome-api-plugin: Provides Font Awesome for Jenkins Plugins. Font Awesome has vector icons and social logos, according to their self-perception it is the web’s most popular icon set and toolkit. Currently, it contains more than 1,500 free icons.
-
popper-api-plugin Provides Popper.js for Jenkins Plugins. Popper can easily position tooltips, popovers or anything else with just a line of code.
-
plugin-util-api-plugin: This small plugin provides some helper and base classes to simplify the creation of reporters in Jenkins. This plugin also provides a set of architecture rules that can be included in an architecture test suite of your plugin.
2. Required changes for a plugin POM
In order to use these plugins you need to add them as dependencies in your plugin pom. You can use the following snippet to add them all:
<project>

 [...]

  <properties>
    <plugin-util-api.version>1.0.2</plugin-util-api.version>
    <font-awesome-api.version>5.12.0-7</font-awesome-api.version>
    <bootstrap4-api.version>4.4.1-10</bootstrap4-api.version>
    <echarts-api.version>4.6.0-8</echarts-api.version>
    <data-tables-api.version>1.10.20-13</data-tables-api.version>
    [...]
  </properties>

  <dependencies>
    <dependency>
      <groupId>io.jenkins.plugins</groupId>
      <artifactId>plugin-util-api</artifactId>
      <version>${plugin-util-api.version}</version>
    </dependency>
    <dependency>
      <groupId>io.jenkins.plugins</groupId>
      <artifactId>font-awesome-api</artifactId>
      <version>${font-awesome-api.version}</version>
    </dependency>
    <dependency>
      <groupId>io.jenkins.plugins</groupId>
      <artifactId>bootstrap4-api</artifactId>
      <version>${bootstrap4-api.version}</version>
    </dependency>
    <dependency>
      <groupId>io.jenkins.plugins</groupId>
      <artifactId>echarts-api</artifactId>
      <version>${echarts-api.version}</version>
    </dependency>
    <dependency>
      <groupId>io.jenkins.plugins</groupId>
      <artifactId>data-tables-api</artifactId>
      <version>${data-tables-api.version}</version>
    </dependency>
    [...]
  </dependencies>

  [...]

</project>
Alternatively, you have a look at the POM files of the Warnings Next Generation Plugin or the Forensics API Plugin which already use these plugins.
3. General structure of a reporter
In this section I will explain some fundamentals of the design of Jenkins, i.e. the Java model and the associated user interface elements. If you are already familiar on how to implement the corresponding extension points of a reporter plugin (see section Extensibility in Jenkins' developer guide), then you can skip this section and head directly to Section 3.1.
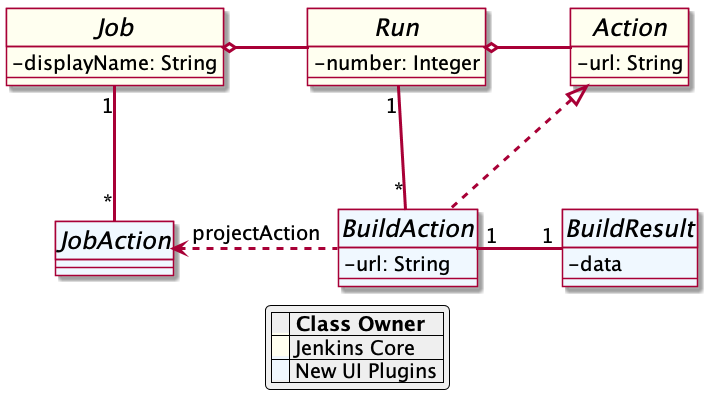
Jenkins organizes projects using the static object model structure shown in Figure 1.
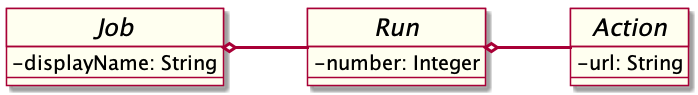
The top level items in Jenkins user interface are jobs (at least the top level items we are interested in). Jenkins contains several jobs of different types (Freestyle jobs, Maven Jobs, Pipelines, etc.).
Each of these jobs contains an arbitrary number of builds (or more technically, runs). Each build is identified by its unique build number. Jenkins plugins can attach results to these builds, e.g. build artifacts, test results, analysis reports, etc. In order to attach such a result, a plugin technically needs to implement and create an action that stores these results.
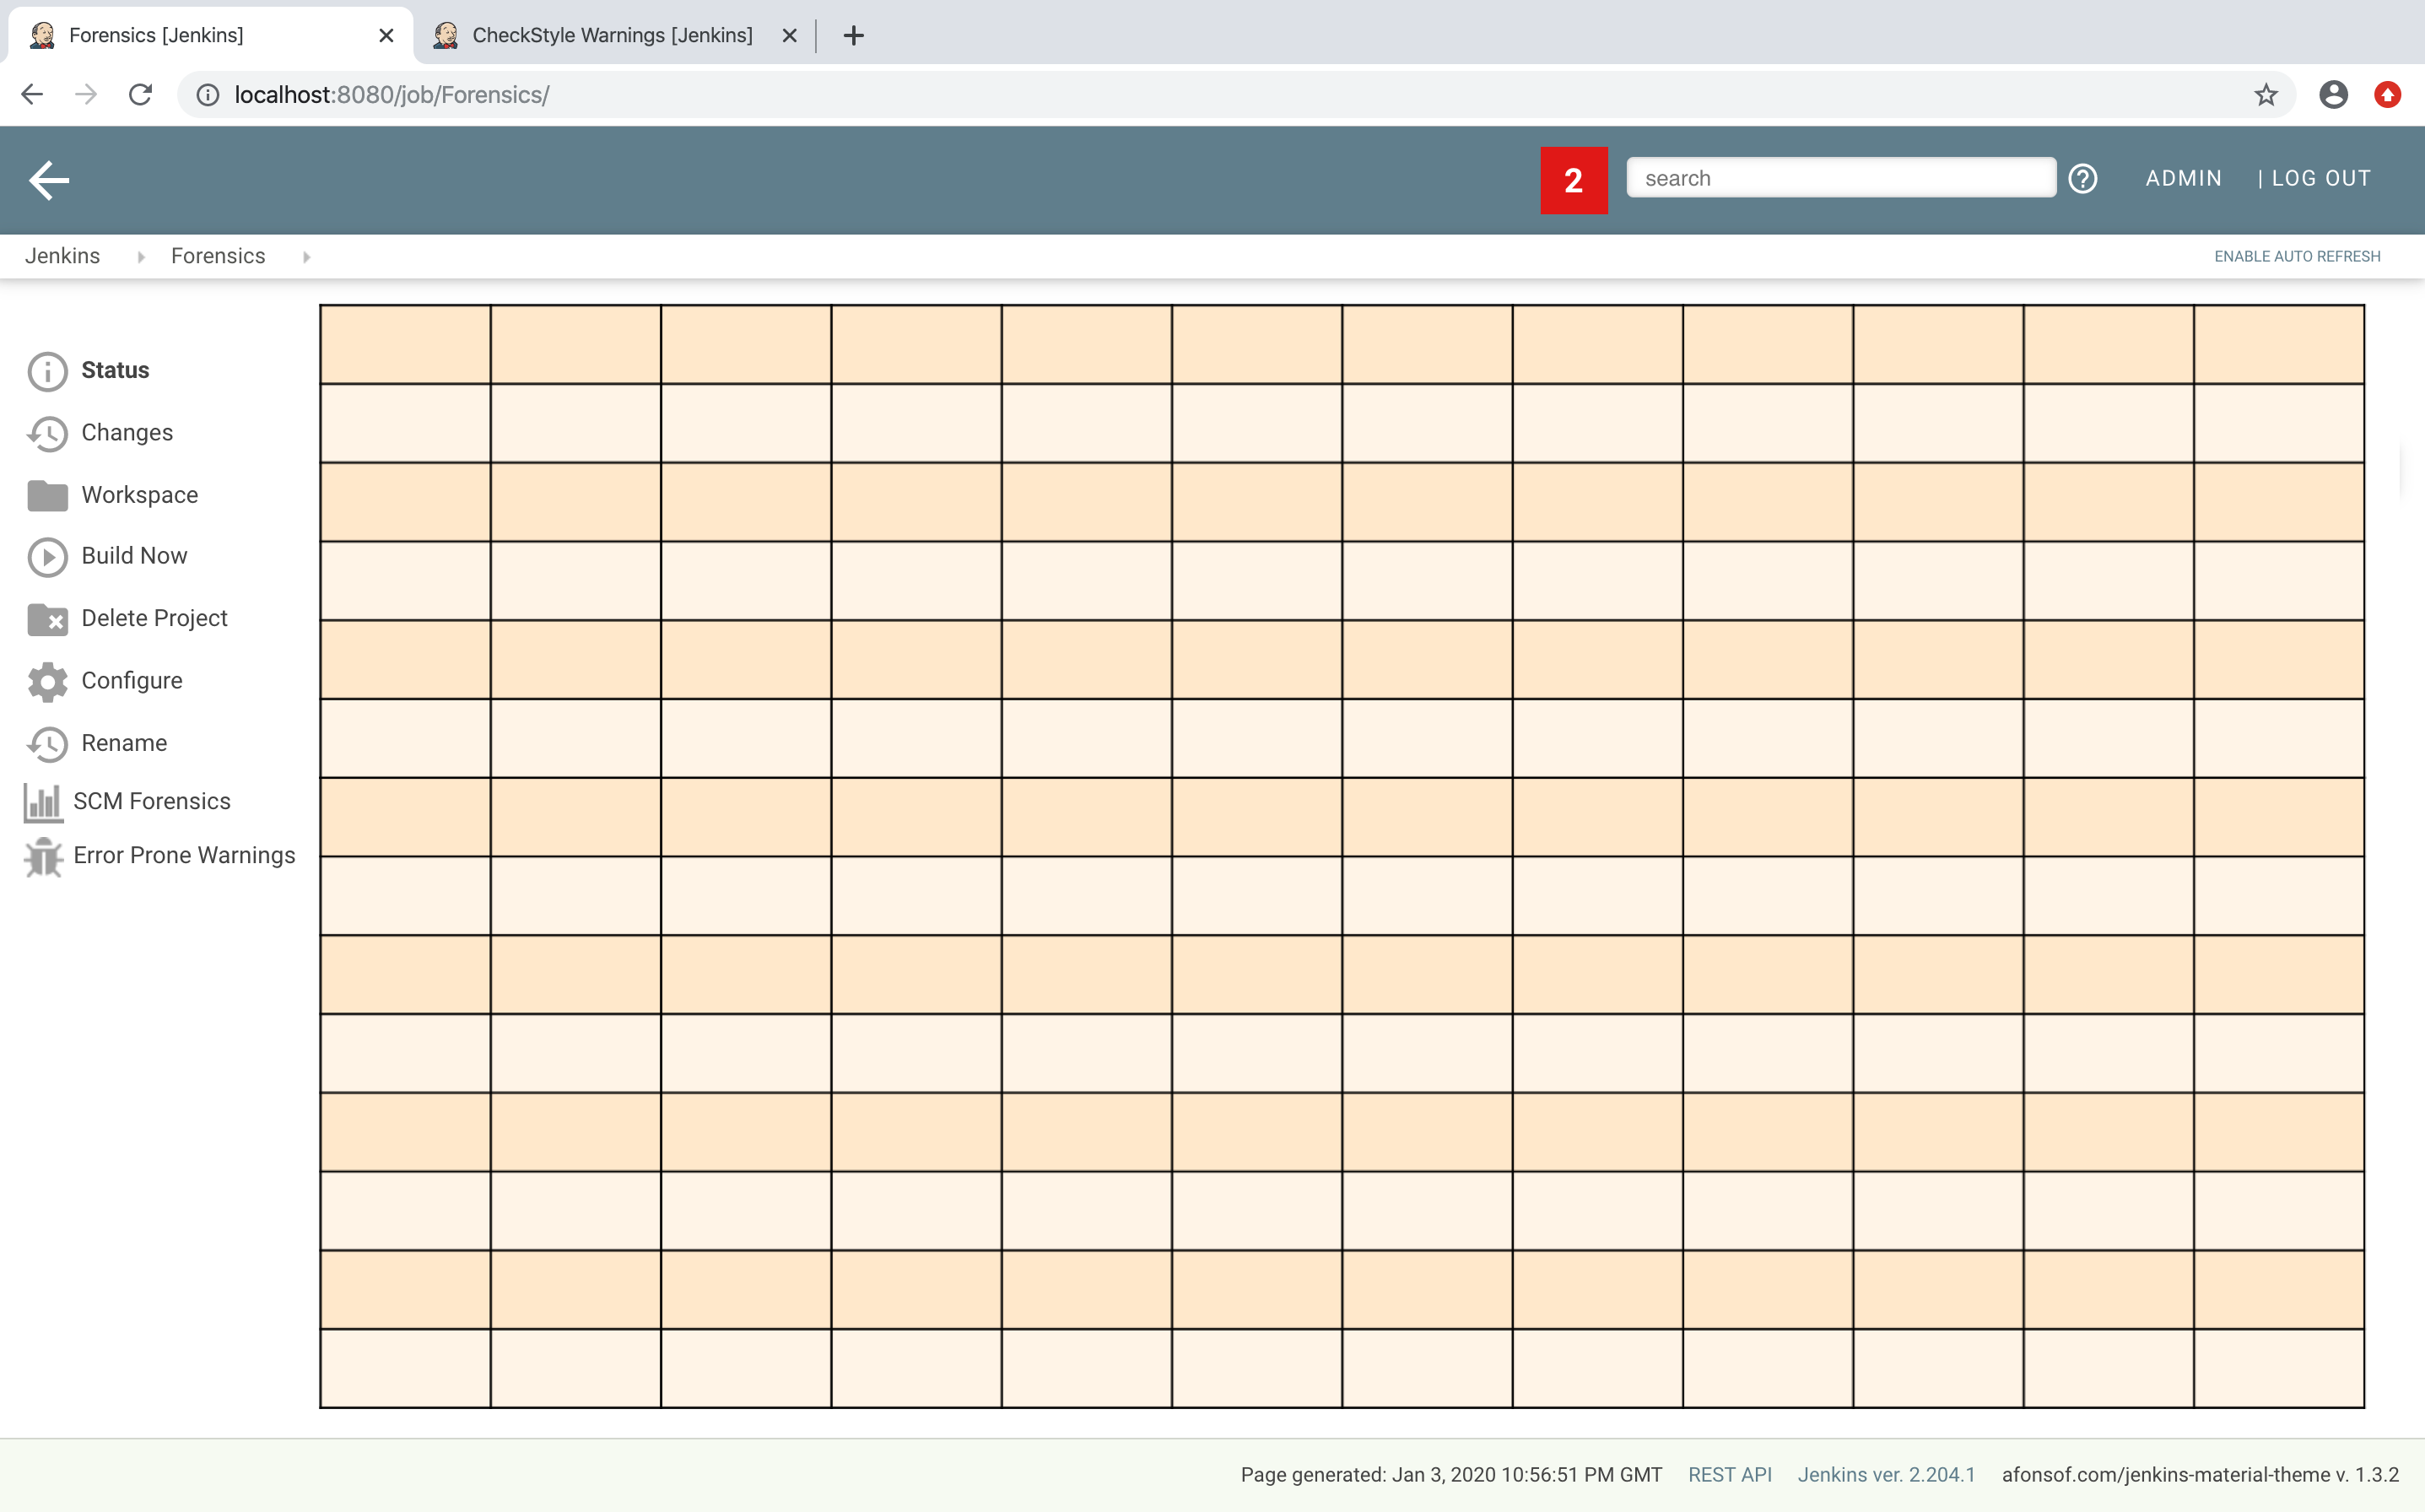
These Java objects are visualized in several different views, which are described in more detail in the following sections. The top-level view that shows all available Jobs is shown in Figure 2.
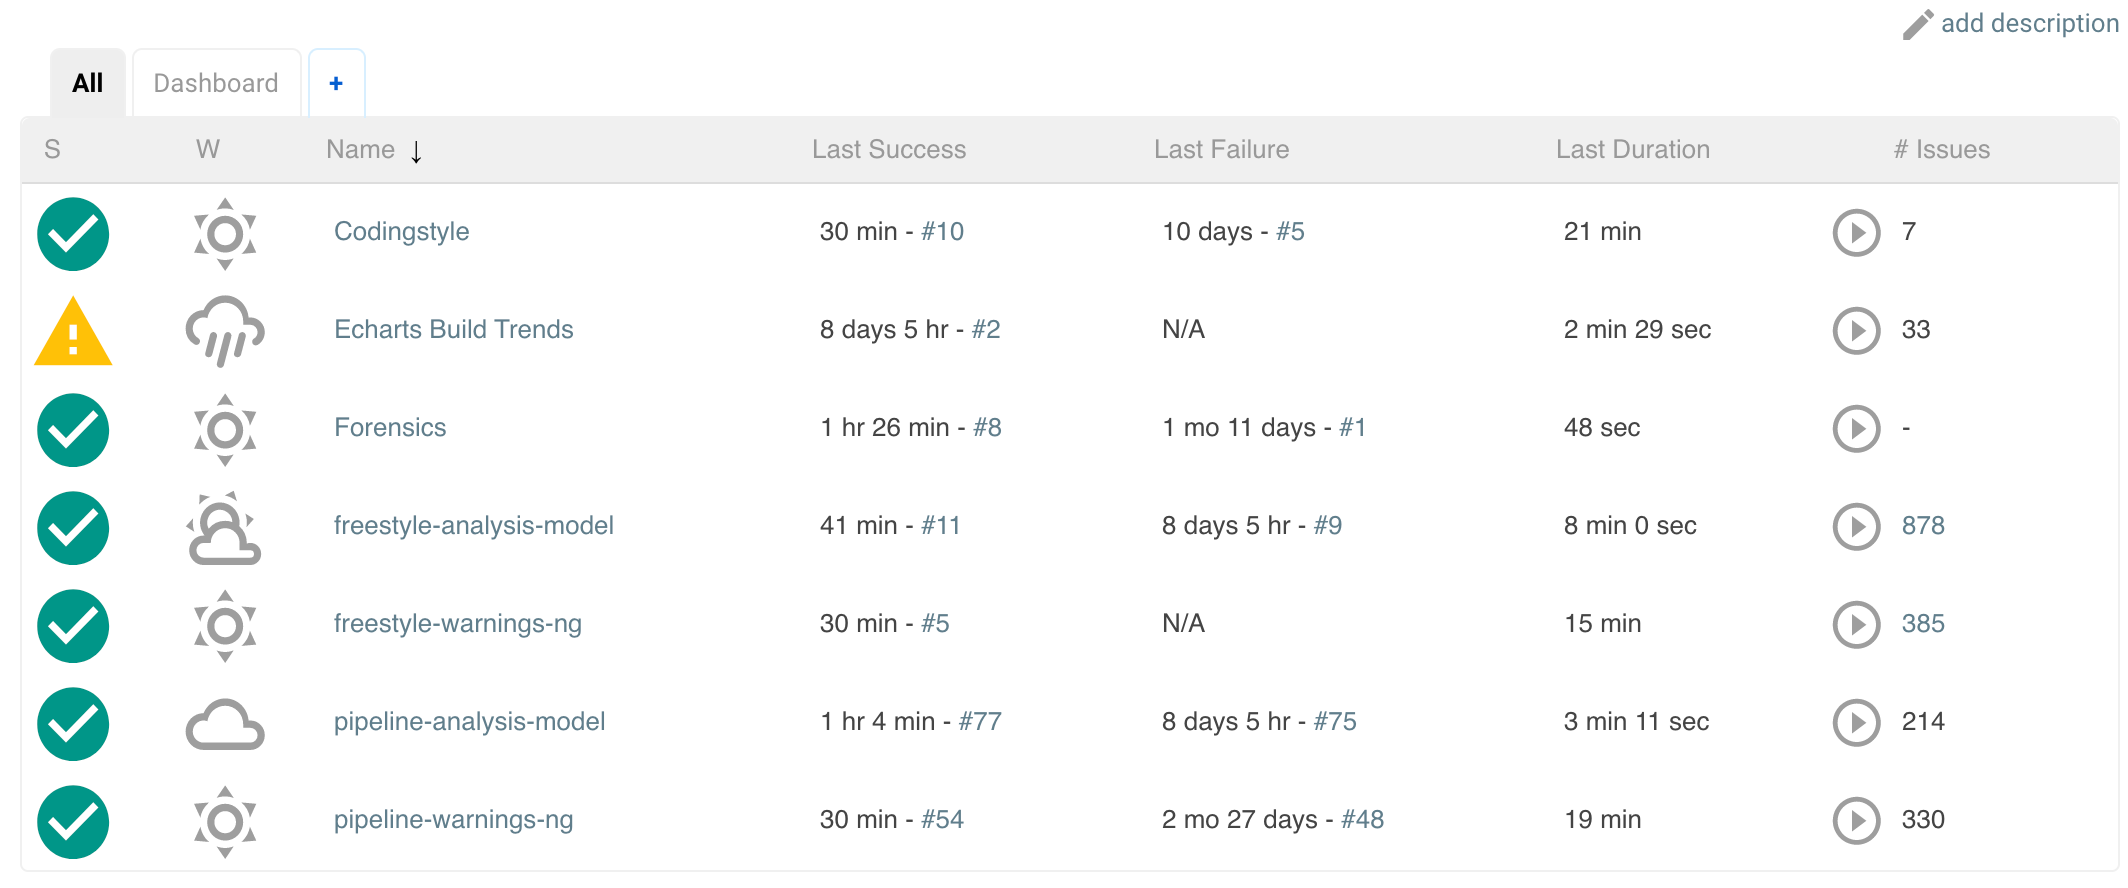
Plugins can also contribute UI elements in these views, but this is out of scope of this guide.
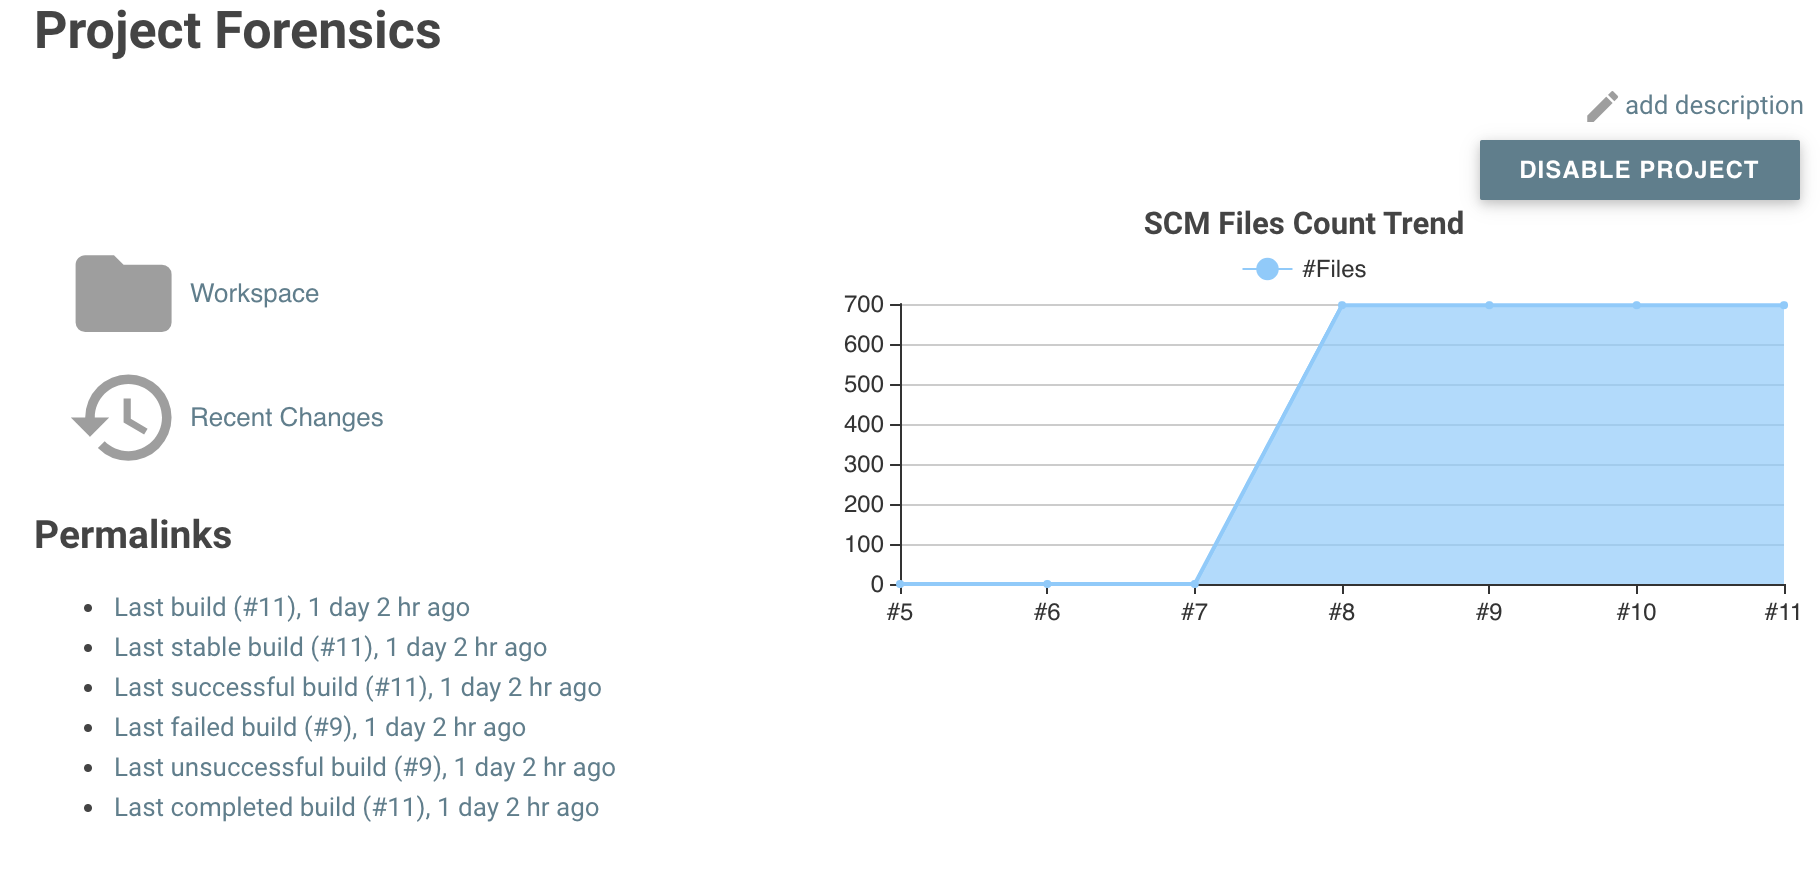
Each job has a detail view, where plugins can extend corresponding extension points and provide summary boxes and trend charts. Typically, summary boxes for reporters are not required on the job level, so I describe only trend charts in more detail, see section Section 5.5.2.
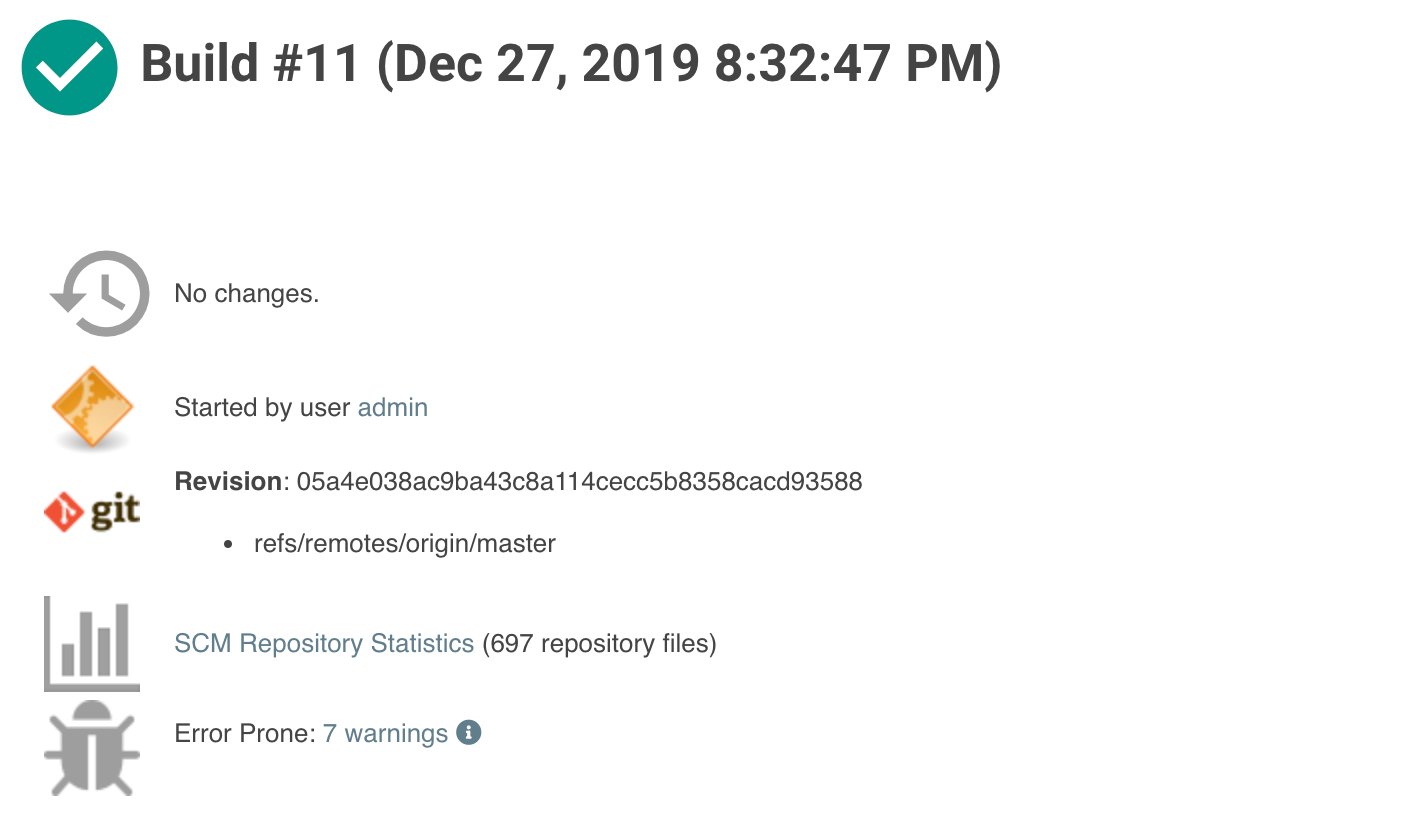
Each build has a detail view as well. Here plugins can provide summary boxes similar to the boxes for the job details view. Typically, plugins show here only a short summary and provide a link to detailed results, see Figure 4 for an example.
The last element in the view hierarchy actually is a dedicated view that shows the results of a specific plugin. E.g., there are views to show the test results, the analysis results, and so on. It is totally up to a given plugin what elements should be shown there. In the next few sections I will introduce some new UI components that can be used to show the corresponding results in a pleasant way.
3.1. Extending Jenkins object model
Since reporters typically are composed in a similar way, I extended Jenkins' original object model (see Figure 1) with some additional elements, so it will be much simpler to create or implement a new reporter plugin. This new model is shown in Figure 5. The central element is a build action that will store the results of a plugin reporter. This action will be attached to each build and will hold (and persist) the results for a reporter. The detail data of each action will be automatically stored in an additional file, so the memory footprint of Jenkins can be kept small if the details are never requested by users. Additionally, this action is also used to simplify the creation of project actions and trend charts, see Section 5.5.2.
4. Git Forensics plugin
The elements in this tutorial will be all used in the new Forensics API Plugin (actually the plugin is not new, it is a dependency of the Warnings Next Generation Plugin). You can download the plugin content and see in more detail how these new components can be used in practice. Or you can change this plugin just to see how these new components can be parameterized.
If you are using Git as source code management system then this plugin will mine the repository in the style of Code as a Crime Scene (Adam Tornhill, November 2013) to determine statistics of the contained source code files:
-
total number of commits
-
total number of different authors
-
creation time
-
last modification time
The plugin provides a new step (or post build publisher) that starts the repository mining and stores the collected information in a Jenkins action (see Figure 5). Afterwards you get a new build summary that shows the total number of scanned files (as trend and as build result). From here you can navigate to the details view that shows the scanned files in a table that can be simply sorted and filtered. You also will get some pie charts that show important aspects of the commit history.
Please note that this functionality of the plugin still is a proof of concept: the performance of this step heavily depends on the size and the number of commits of your Git repository. Currently it scans the whole repository in each build. In the near future I hope to find a volunteer who is interested in replacing this dumb algorithm with an incremental scanner.
5. Introducing the new UI components
As already mentioned in Section 3, a details view is plugin specific. What is shown and how these elements are presented is up to the individual plugin author. So in the next sections I provide some examples and new concepts that plugins can use as building blocks for their own content.
5.1. Modern icons
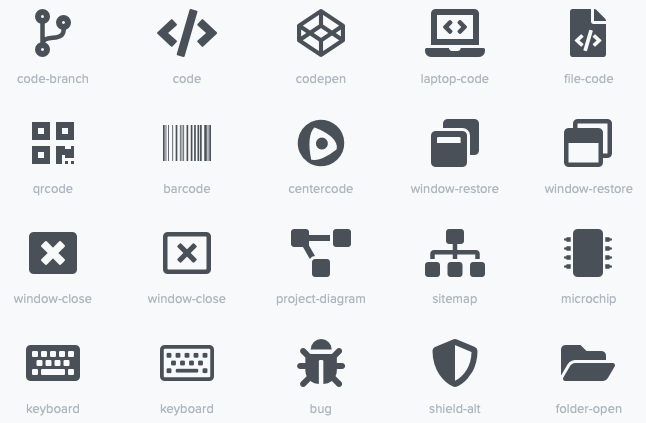
Jenkins plugins typically do not use icons very frequently. Most plugins provide an icon for the actions and that’s it. If you intend to use icons in other places, plugin authors are left on their own: the recommended Tango icon set is more than 10 years old and too limited nowadays. There are several options available, but the most popular is the Font Awesome Icon Set. It provides more than 1500 free icons that follow the same design guidelines:
In order to use Font Awesome icons in a plugin you simply need a dependency to the corresponding
font-awesome-api-plugin. Then you can use any of the solid icons
by using the new tag svg-icon in your jelly view:
1
2
3
4
5
6
7
<j:jelly xmlns:j="jelly:core" xmlns:st="jelly:stapler" xmlns:l="/lib/layout" xmlns:fa="/font-awesome">

  [...]
  <fa:svg-icon name="check-double" class="no-issues-banner"/>
  [...]

</j:jelly>
If you are generating views using Java code, then you also can use the class SvgTag to generate the
HTML markup for such an icon.
5.2. Grid layout
Jenkins currently includes in all views an old and patched version of Bootstrap’s grid system (with 24 columns). This version
is not compatible with Bootstrap 4 or any of the JS libraries that depend on Bootstrap4. In order to use Bootstrap 4
features we need to replace the Jenkins provided layout.jelly file with a patched version, that does not load
the broken grid system. I’m planning to create a PR that fixes the grid in Jenkins core, but that will take some time.
Until then you will need to use the provided layout.jelly of the Bootstrap4 plugin, see below.
|
The first thing to decide is, which elements should be shown on a plugin page and how much space each element should occupy. Typically, all visible components are mapped on the available space using a simple grid. In a Jenkins view we have a fixed header and footer and a navigation bar on the left (20 percent of the horizontal space). The rest of a screen can be used by a details view. In order to simplify the distribution of elements in that remaining space we use Bootstrap’s grid system.
That means, a view is split into 12 columns and and arbitrary number of rows. This grid system is simple to use (but complex enough to also support fancy screen layouts) - I won’t go into details here, please refer to the Bootstrap documentation for details.
For the forensics detail view we use a simple grid of two rows and two columns. Since the number of columns always is 12 we need to create two "fat" columns that fill 6 of the standard columns. In order to create such a view in our plugin we need to create a view given as a jelly file and a corresponding Java view model object. A view with this layout is shown in the following snippet:
 1
 2
 3
 4
 5
 6
 7
 8
 9
10
11
12
13
14
15
16
17
18
19
20
21
22
23
24
25
26
27
28
<?jelly escape-by-default='true'?>
<j:jelly xmlns:j="jelly:core" xmlns:st="jelly:stapler" xmlns:l="/lib/layout" xmlns:bs="/bootstrap">

  <bs:layout title="${it.displayName}" norefresh="true"> (1)
    <st:include it="${it.owner}" page="sidepanel.jelly"/>
    <l:main-panel>
      <st:adjunct includes="io.jenkins.plugins.bootstrap4"/> (2)
      <div class="fluid-container"> (3)

        <div class="row py-3"> (4)
          <div class="col-6"> (5)
            Content of column 1 in row 1
          </div>
          <div class="col-6"> (6)
            Content of column 2 in row 1
          </div>
        </div>

        <div class="row py-3"> (7)
          <div class="col"> (8)
            Content of row 2
          </div>
        </div>

      </div>
    </l:main-panel>
  </bs:layout>
</j:jelly>
| 1 | Use a custom layout based on Bootstrap: since Jenkins core contains an old version of Bootstrap, we need to replace the standard layout.jelly file. |
| 2 | Import Bootstrap 4: Importing of JS and CSS components is done using the adjunct concept, which is the preferred way of referencing static resources within Jenkins' Stapler Web framework. |
| 3 | The whole view will be placed into a fluid container that fills up the whole screen (100% width). |
| 4 | A new row of the view is specified with class row. The additional class py-3 defines the padding to use for
this row, see Bootstrap Spacing for more details. |
| 5 | Since Bootstrap automatically splits up a row into 12 equal sized columns we define here that the first column should occupy 6 of these 12 columns. You can also leave off the detailed numbers, then Bootstrap will automatically distribute the content in the available space. Just be aware that this not what you want in most of the times. |
| 6 | The second column uses the remaining space, i.e. 6 of the 12 columns. |
| 7 | The second row uses the same layout as row 1. |
| 8 | There is only one column for row 1, it will fill the whole available space. |
You can also specify different column layouts for one row, based on the actual visible size of the screen. This helps to improve the layout for larger screens. In the warnings plugin you will find an example: on small devices, there is one card visible that shows one pie chart in a carousel. If you are opening the same page on a larger device, then two of the pie charts are shown side by side and the carousel is hidden.
5.3. Cards
When presenting information of a plugin as a block, typically plain text elements are shown. This will normally result in some kind of boring web pages. In order to create a more appealing interface, it makes sense to present such information in a card, that has a border, a header, an icon, and so on. In order to create such a Bootstrap card a small jelly tag has been provided by the new Bootstrap plugin that simplifies this task for a plugin. Such a card can be easily created in a jelly view in the following way:
1
2
3
<bs:card title="${%Card Title}" fontAwesomeIcon="icon-name">
  Content of the card
</bs:card>
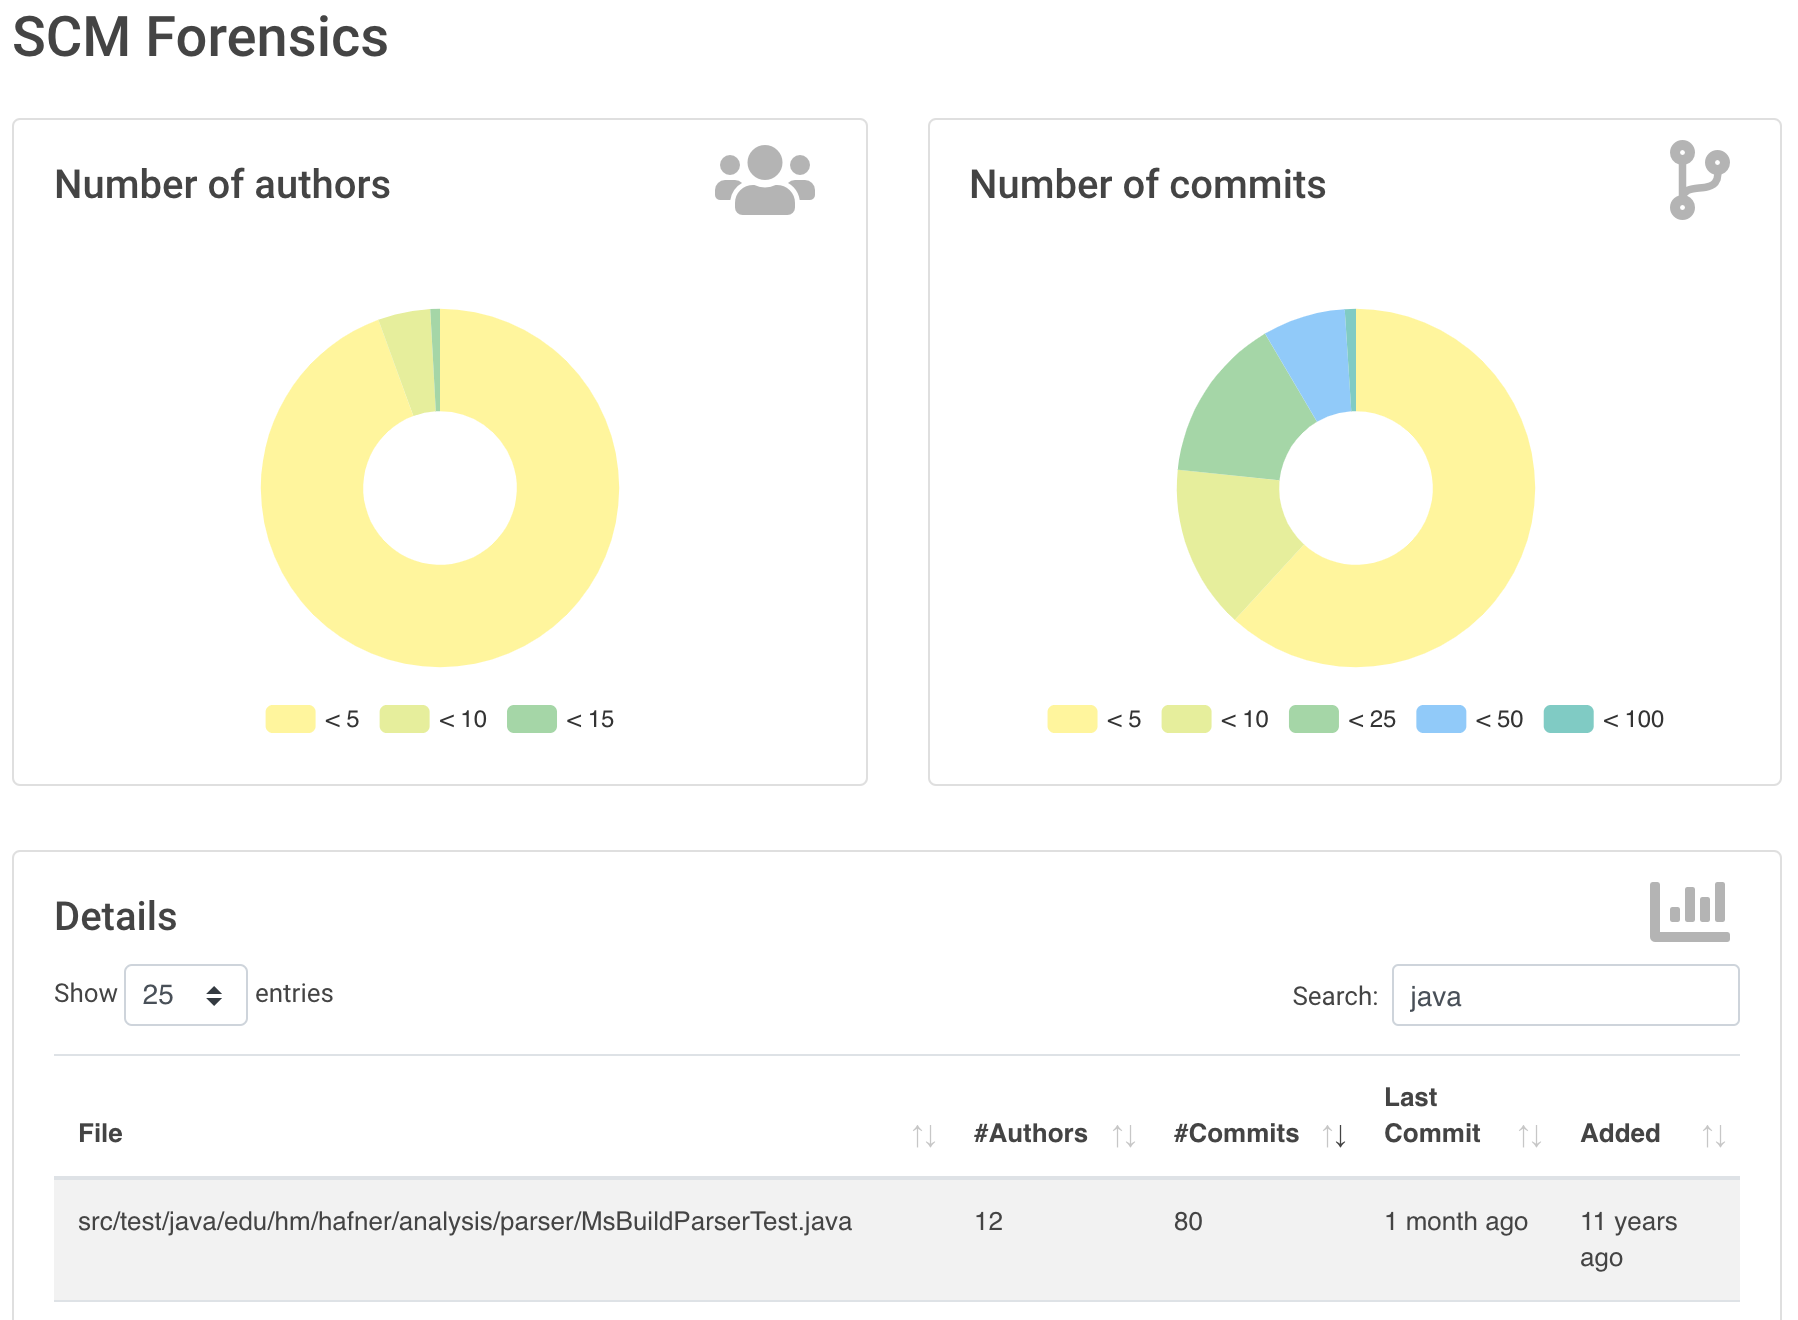
In Figure 8 examples of such cards are shown. The cards in the upper row contain pie charts that show the distribution of the number of authors and commits in the whole repository. The card at the bottom shows the detail information in a DataTable. The visualization is not limited to charts or tables, you can show any kind of HTML content in there. You can show any icon of your plugin in these cards, but it is recommended to use one of the existing Font Awesome icons to get a consistent look and feel in Jenkins' plugin ecosystem.
Note that the size of the cards is determined by the grid configuration, see Section 5.2.
5.4. Tables
A common UI element to show plugin details is a table control. Most plugins (and Jenkins core) typically use plain HTML tables. However, if the table should show a large number of rows then using a more sophisticated control like DataTables makes more sense. Using this JS based table control provides additional features at no cost:
-
filter results by text search
-
provide pagination of the result set
-
sort data by multiple columns at once
-
obtain table rows using Ajax calls
-
show and hide columns based on the screen resolution
In order to use DataTables in a view there are two options, you can either decorate existing static HTML tables (see Section 5.4.1) or populate the table content using Ajax (see Section 5.4.2).
5.4.1. Tables with static HTML content
The easiest way of using DataTables is by creating a static HTML table that will be decorated by simply calling the constructor of the datatable. This approach involves no special handling on the Java and Jelly side, so I think it is sufficient to follow the example in the DataTables documentation. Just make sure that after building the table in your Jelly file you need to decorate the table with the following piece of code:
<j:jelly xmlns:j="jelly:core" xmlns:st="jelly:stapler" >

  <st:adjunct includes="io.jenkins.plugins.jquery3"/>
  <st:adjunct includes="io.jenkins.plugins.data-tables"/>

  [...]

    <div class="table-responsive">
        <table class="table table-hover table-striped display" id="id">
            [...]
        </table>
    </div>

  [...]
  <script>
     $('#id').DataTable(); (1)
  </script>

</j:jelly>| 1 | replace id with the ID of your HTML table element |
In the Forensics plugin no such static table is used so far, but you can have a look at the table that shows fixed warnings in the warnings plugin to see how such a table can be decorated.
5.4.2. Tables with dynamic model based content
While static HTML tables are easy to implement, they have several limitations. So it makes sense to follow a more sophisticated approach. Typically, tables in user interfaces are defined by using a corresponding table (and row) model. Java Swing successfully provides such a table model concept since the early days of Java. I adapted these concepts for Jenkins and DataTables as well. In order to create a table in a Jenkins view a plugin needs to provide a table model class, that provides the following information:
-
the ID of the table (since there might be several tables in the view)
-
the model of the columns (i.e., the number, type, and header labels of the columns)
-
the content of the table (i.e. the individual row objects)
You will find an example of such a table in the Forensics plugin: here a table lists the files in your Git repository combined with the corresponding commit statistics (number of authors, number of commits, last modification, first commit). A screenshot of that table is shown in Figure 9.
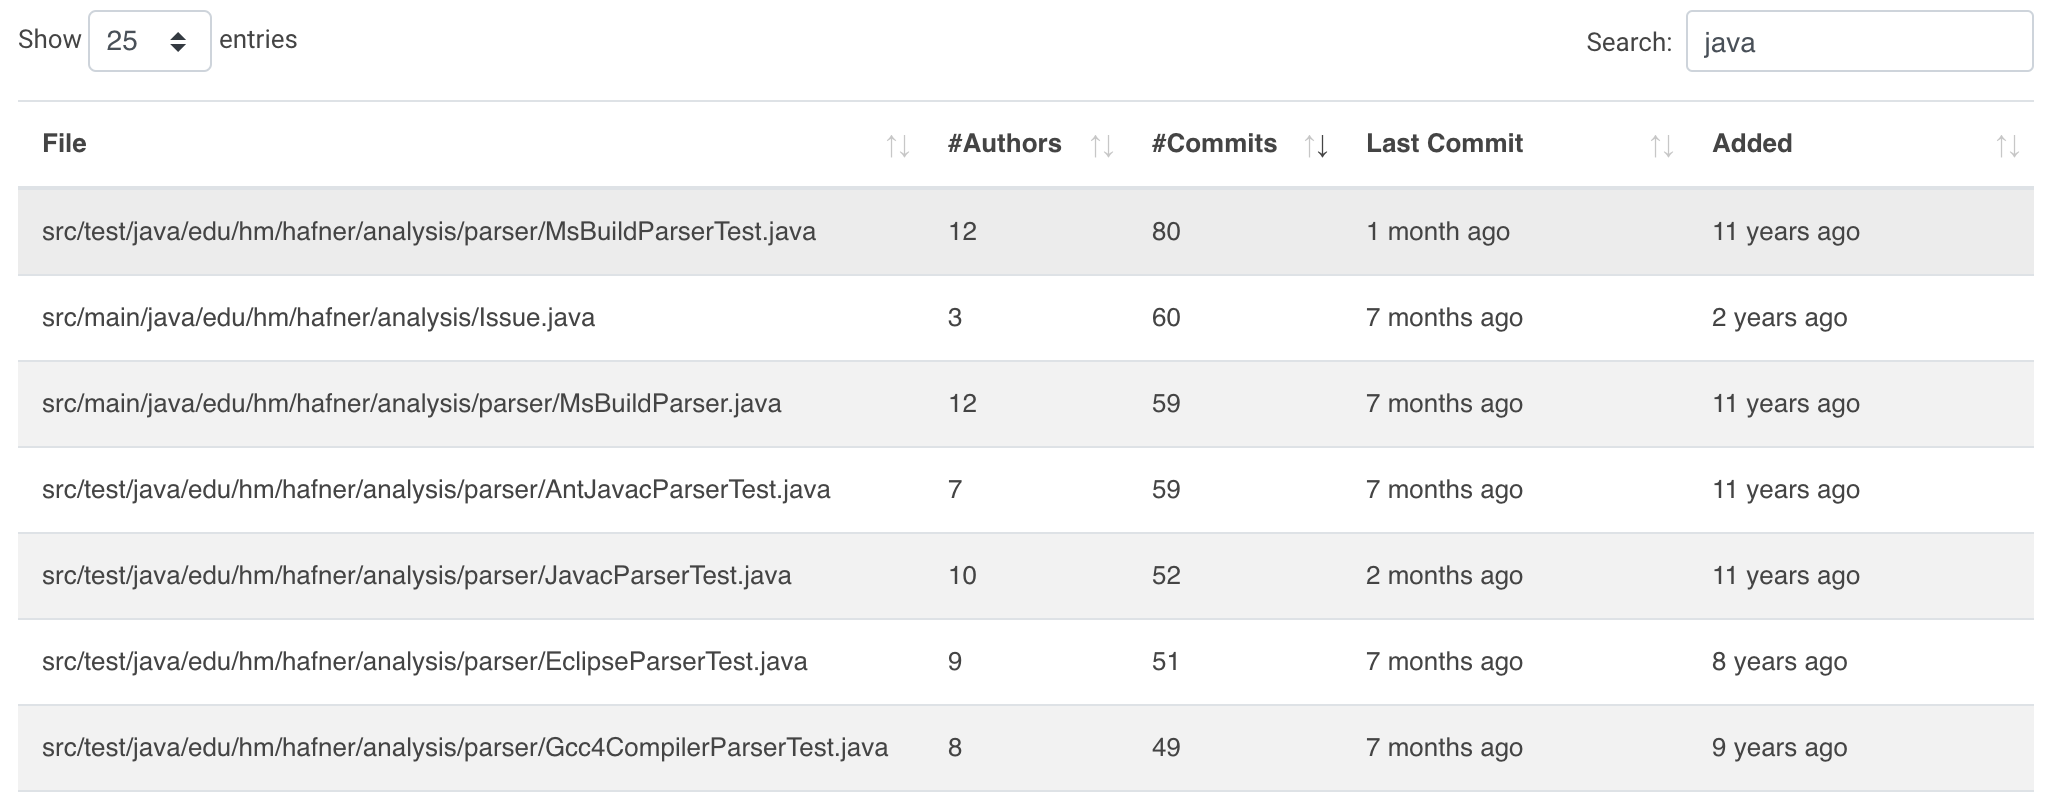
In order to create such a table in Jenkins, you need to create a table model class that derives from TableModel.
In Figure 10 a diagram of the corresponding classes in the Forensics plugin is shown.
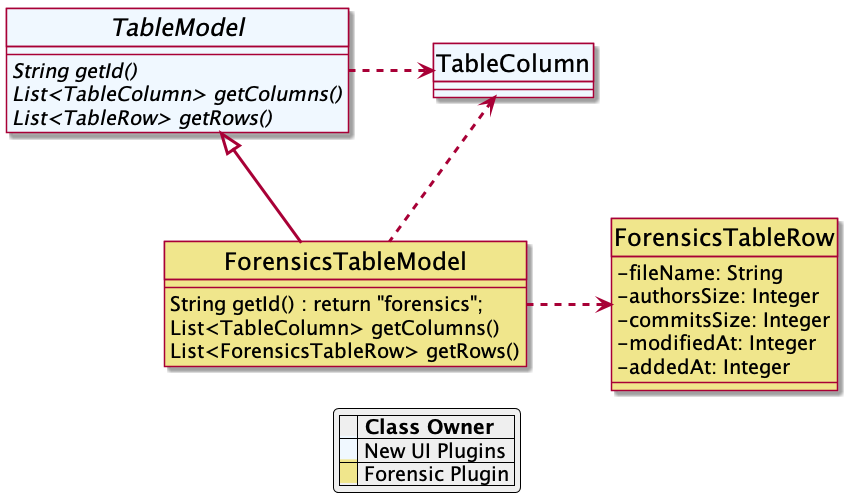
Table column model
This first thing a table model class defines is a model of the available columns by creating corresponding
TableColumn instances. For each column you need to specify a header label and the name of the bean property that
should be shown in the corresponding column (the row elements are actually Java beans: each column will
show one distinct property of such a bean, see next section). You can
use any of the supported column types by simply providing a
String or Integer based column.
Table rows content
Additionally, a table model class provides the content of the rows. This getRows() method
will be invoked asynchronously using an Ajax call. Typically, this method simply returns a list of Java Bean instances,
that provide the properties of each column (see previous section). These objects will be converted automatically
to an array of JSON objects, the basic data structure required for the DataTables API.
You will find a fully working example table model
implementation in the Git repository of the forensics plugin in the class
ForensicsTableModel.
In order to use such a table in your plugin view you need to create the table in the associated
Jelly file using the new table tag:
<j:jelly xmlns:j="jelly:core" xmlns:dt="/data-tables" >
    [...]
    <st:adjunct includes="io.jenkins.plugins.data-tables"/>

    <dt:table model="${it.getTableModel('id')}"/> (1)
    [...]
</j:jelly>| 1 | replace id with the id of your table |
The only parameter you need to provide for the table is the model — it is typically part of the corresponding
Jenkins view model class (this object is referenced with ${it} in the view).
In order to connect the corresponding Jenkins view model class with the table, the view model class needs to
implement the AsyncTableContentProvider interface. Or even simpler, let your view model class derive from
DefaultAsyncTableContentProvider. This relationship is required, so that Jenkins can automatically create
and bind a proxy for the Ajax calls that will automatically fill the table content after the HTML page has been created.
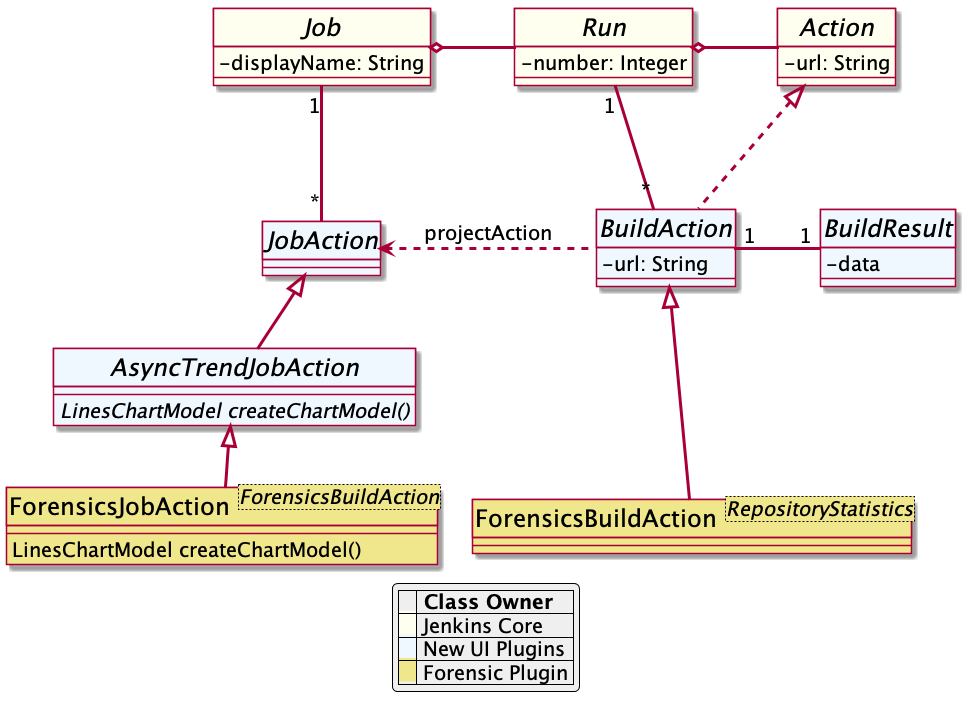
If we put all those pieces together, we are required to define a model similar to the model of the Forensics plugin, that is shown in Figure 11.
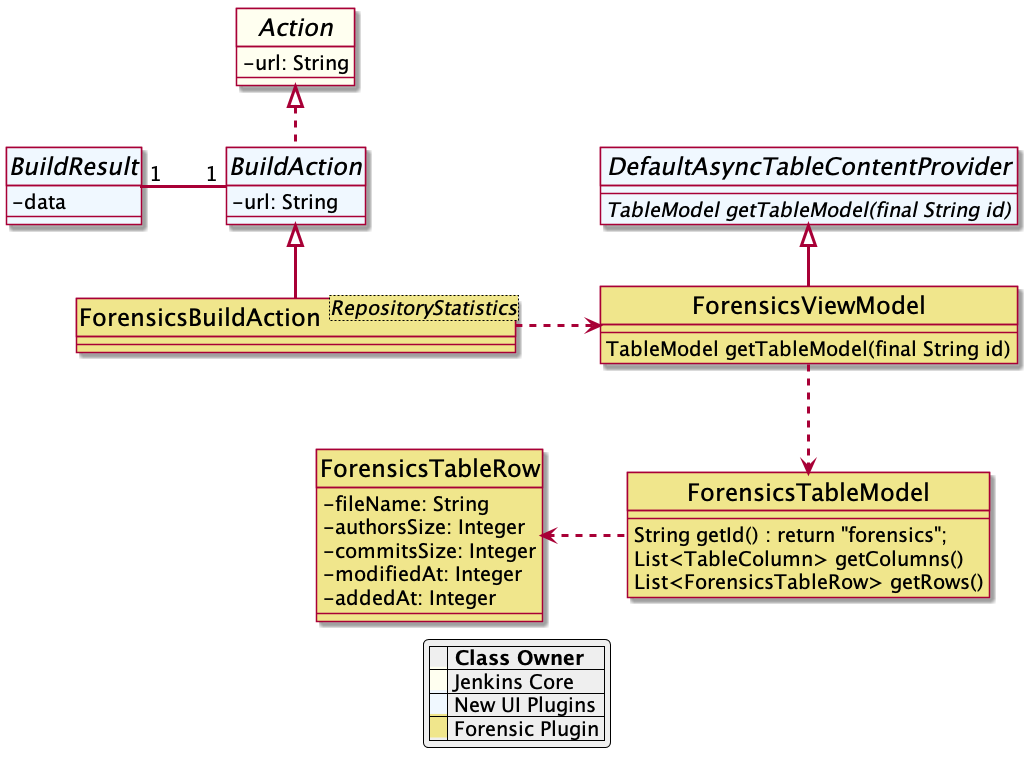
As already described in Figure 5 the plugin needs to attach a BuildAction to each build. The
Forensics plugin attaches a ForensicBuildAction to the build. This action stores a RepositoryStatistics instance,
that contains the repository results for a given build. This action delegates all Stapler requests to a new
Stapler proxy instance so we can keep the
action clean of user interface code. This ForensicsViewModel class then acts as view model that provides the server
side model for the corresponding Jelly view given by the file index.jelly.
While this approach looks quite complex at a first view, you will see that the actual implementation part is quite small. Most of the boilerplate code is already provided by the base classes and you need to implement only a few methods. Using this concept also provides some additional features, that are part of the DataTables plugin:
-
Ordering of columns is persisted automatically in the browser local storage.
-
Paging size is persisted automatically in the browser local storage.
-
The Ajax calls are actually invoked only if a table will become visible. So if you have several tables hidden in tabs then the content will be loaded on demand only, reducing the amount of data to be transferred.
-
There is an option available to provide an additional details row that can be expanded with a + symbol, see warnings plugin table for details.
5.5. Charts
A plugin reporter typically also reports some kind of trend from build to build. Up to now Jenkins core provides only a quite limited concept of rendering such trends as trend charts. The JFreeChart framework offered by Jenkins core is a server side rendering engine that creates charts as static PNG images that will be included on the job and details pages. Nowadays, several powerful JS based charting libraries are available, that do the same job (well actually an even better job) on the client side. That has the advantage that these charts can be customized on each client without affecting the server performance. Moreover, you get a lot of additional features (like zooming, animation, etc.) for free. Additionally, these charting libraries not only support the typical build trend charts but also a lot of additional charts types that can be used to improve the user experience of a plugin. One of those charting libraries is ECharts: this library has a powerful API and supports literally every chart type one can image of. You can get some impressions of the features on the examples page of the library.
In order to use these charts one can embed charts that use this library by importing the corresponding JS files and by defining the chart in the corresponding Jelly file. While that already works quite well it will be still somewhat cumbersome to provide the corresponding model for these charts from Jenkins build results. So I added a powerful Java API that helps to create the model for these charts on the Java side. This API provides the following features:
-
Create trend charts based on a collection of build results.
-
Separate the chart type from the aggregation in order to simplify unit testing of the chart model.
-
Toggle the type of the X-Axis between build number or build date (with automatic aggregation of results that have been recorded at the same day).
-
Automatic conversion of the Java model to the required JSON model for the JS side.
-
Support for pie and line charts (more to come soon).
Those charts can be used as trend chart in the project page (see Figure 3) or as information chart in the details view of a plugin (see Section 5).
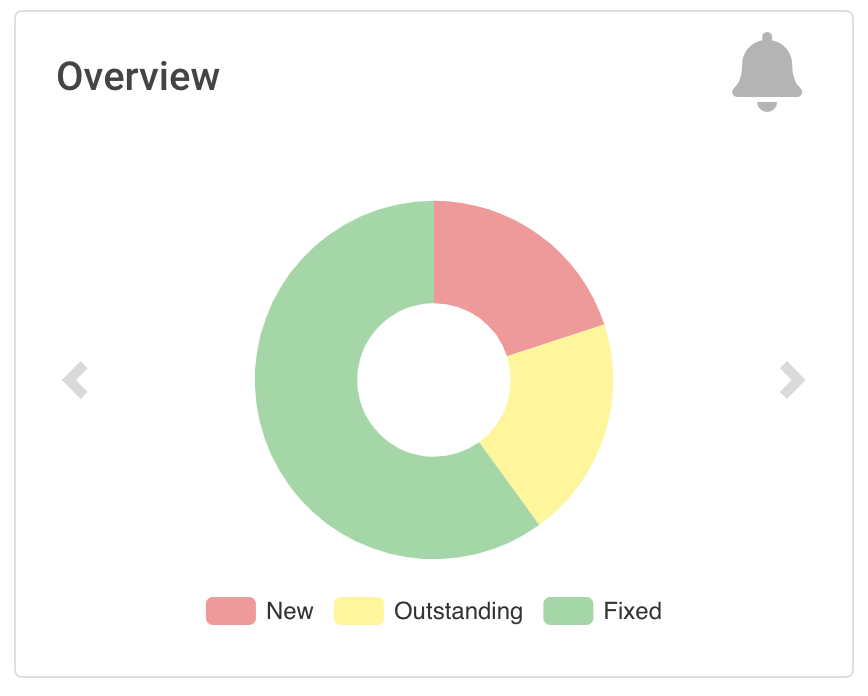
5.5.1. Pie charts
A simple but still informative chart is a pie chart that illustrates numerical proportions of plugin data. In the Forensics plugin I am using this chart to show the numerical proportions of the number of authors or commits for the source code files in the Git repository (see Figure 8). In the warnings plugin I use this chart to show the numerical proportions of the new, outstanding, or fixed warnings, see Figure 12.
In order to include such a chart in your details view, you can use the provided pie-chart tag.
In the following snippet you see this tag in action (embedded in a Bootstrap card, see Section 5.3):
 1
 2
 3
 4
 5
 6
 7
 8
 9
10
<?jelly escape-by-default='true'?>
<j:jelly xmlns:j="jelly:core"  xmlns:c="/charts" xmlns:bs="/bootstrap">

    [...]
    <bs:card title="${%Number of authors}" fontAwesomeIcon="users">
      <c:pie-chart id="authors" model="${it.authorsModel}" height="256" />
    </bs:card>
    [...]

</j:jelly>
You need to provide a unique ID for this chart and the corresponding model value. The model must be the JSON
representation of a corresponding PieChartModel instance. Such a model can be created with a couple of lines:
1
2
3
4
5
6
7
8
9
    [...]
    PieChartModel model = new PieChartModel("Title");

    model.add(new PieData("Segment 1 name", 10), Palette.RED);
    model.add(new PieData("Segment 2 name", 15), Palette.GREEN);
    model.add(new PieData("Segment 3 name", 20), Palette.YELLOW);

    String json = new JacksonFacade().toJson(model);
    [...]
5.5.2. Trend charts on the job level view
In order to show a trend that renders a line chart on the job page (see Figure 3) you need to provide a so called
floating box (stored in the file floatingBox.jelly of your job action (see Section 3)).
The content of this file is quite simple and contains just a trend-chart tag:
1
2
3
4
5
6
<?jelly escape-by-default='true'?>
<j:jelly xmlns:j="jelly:core" xmlns:c="/charts">

  <c:trend-chart it="${from}" title="${%SCM Files Count Trend}" enableLinks="true"/>

</j:jelly>
On the Java side the model for the chart needs to be provided in the corresponding sub class of JobAction (which is
the owner of the floating box). Since the computation of trend charts is quite expensive on the server side as well
(several builds need to be read from disk and the interesting data points need to be computed) this process has been
put into a separate background job. Once the computation is done the result is shown via an Ajax call. In order to
hide these details for plugin authors you should simply derive your JobAction class from the corresponding
AsyncTrendJobAction class, that already contains the boilerplate code. So your static plugin object model will actually
become a little bit more complex:
Basically, you need to implement the method LinesChartModel createChartModel() to create the line
chart. This method is quite simple to implement, since most of the hard work is provided by the library: you will
invoke with an iterator of your build actions, starting with the latest build. The iterator advances from build to build
until no more results are available (or the maximum number of builds to consider has been reached). The most important
thing to implement in your plugin is the way how data points are computed for a given BuildAction. Here is an example of
such a SeriesBuilder implementation in the Forensics Plugin:
 1
 2
 3
 4
 5
 6
 7
 8
 9
10
11
12
13
14
15
16
17
18
19
20
21
22
package io.jenkins.plugins.forensics.miner;

import java.util.HashMap;
import java.util.Map;

import edu.hm.hafner.echarts.SeriesBuilder;

/**
 * Builds one x-axis point for the series of a line chart showing the number of files in the repository.
 *
 * @author Ullrich Hafner
 */
public class FilesCountSeriesBuilder extends SeriesBuilder<ForensicsBuildAction> {
    static final String TOTALS_KEY = "total";

    @Override
    protected Map<String, Integer> computeSeries(final ForensicsBuildAction current) {
        Map<String, Integer> series = new HashMap<>();
        series.put(TOTALS_KEY, current.getNumberOfFiles());
        return series;
    }
}
You are not limited to a single line chart. You can show several lines in a single chart, you can show stacked values, or even the delta between some values. You can also have a look at the charts of the warnings plugin to see some of these features in detail.
About the author